Contribution Margin in 2026: A Field Guide From Live Accounts
Revenue is loud and profit is quiet. Contribution margin is the number that sits between them and tells you whether each order is actually helping the business. We put it at the centre of every paid media account we run, and this guide explains why and how.

Key takeaways
- Contribution margin is what is left from each sale after the costs that rise and fall with that sale. It is the money available to pay for fixed costs and profit.
- Split it into layers: CM1 after product cost, CM2 after fulfilment and fees, CM3 after marketing. CM3 is the number paid media should be judged on.
- Your contribution margin before ads sets your break-even ROAS. Without it, ad targets are guesses.
- Calculate it by product and by channel. Averages hide products that lose money every time they are advertised.
- The fastest improvements usually come from price, bundles, shipping rules and product mix, not from cutting ad spend alone.
01What contribution margin means in plain terms
Every order has costs that exist only because that order happened: the product itself, packing, shipping, payment fees, marketplace fees, and the advertising that brought the buyer in. Contribution margin is what is left after you subtract those variable costs from the revenue. It is the amount each sale contributes towards rent, salaries, software and, eventually, profit.
The basic formula is simple: contribution margin = revenue minus variable costs. Divide by revenue and you get the contribution margin ratio, a percentage that shows how much of each sale is available to cover fixed costs.
Accountants have used this idea for a long time. What has changed is how central it has become for brands that grow through paid media. When ad costs are one of your biggest variable costs, you cannot judge advertising without it. Our ad spend ROI guide introduced the idea. This post goes into the detail.
02CM1, CM2 and CM3: the layers that matter
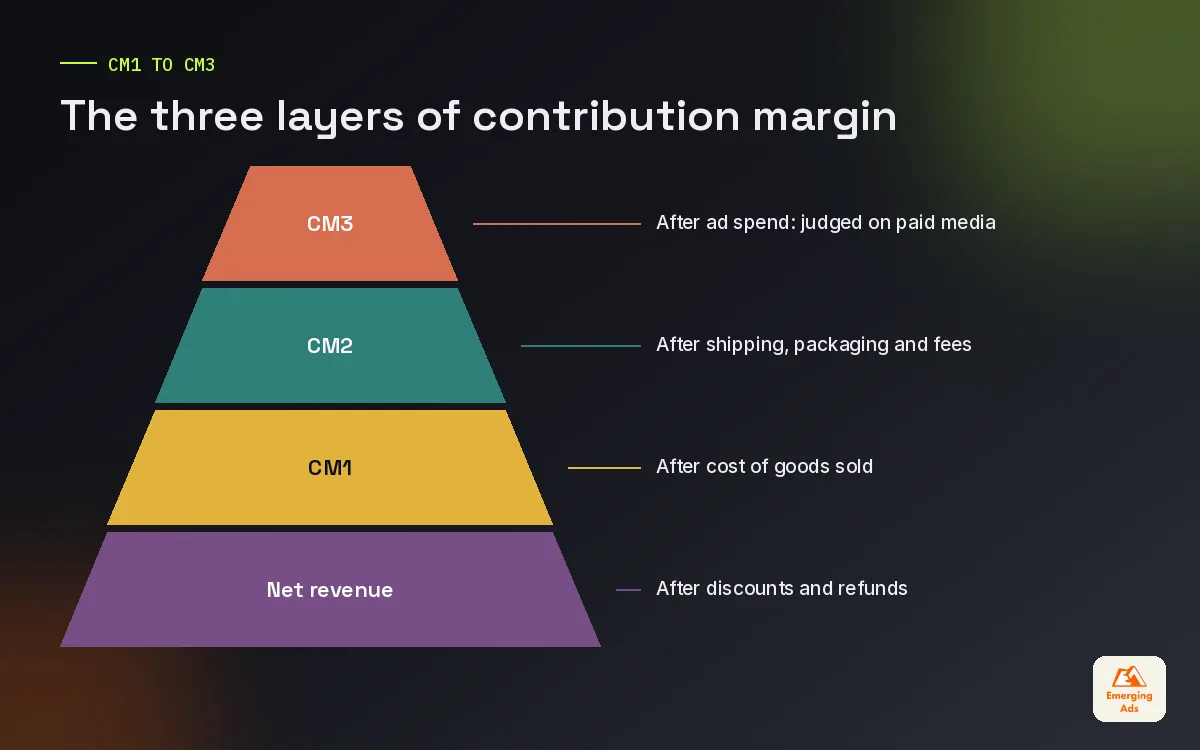
Many e-commerce teams split contribution margin into three layers. It makes it far easier to see where money is going and who can fix it.
| Layer | Calculation | Who owns it |
|---|---|---|
| CM1 | Net revenue minus cost of goods sold | Product, buying and pricing |
| CM2 | CM1 minus fulfilment, shipping, packaging, payment and marketplace fees | Operations and logistics |
| CM3 | CM2 minus marketing and ad spend | Marketing and paid media |
Net revenue here means revenue after discounts, refunds and taxes you pass on. That detail catches many brands out. A promotion that doubles orders at 30 percent off can shrink CM1 so much that nothing is left for shipping and ads.
CM3 is the number we hold paid media accountable for. It answers the only question that matters about advertising: after everything it cost to find, sell and deliver to this customer, did the order leave money on the table for the business?
03A worked example
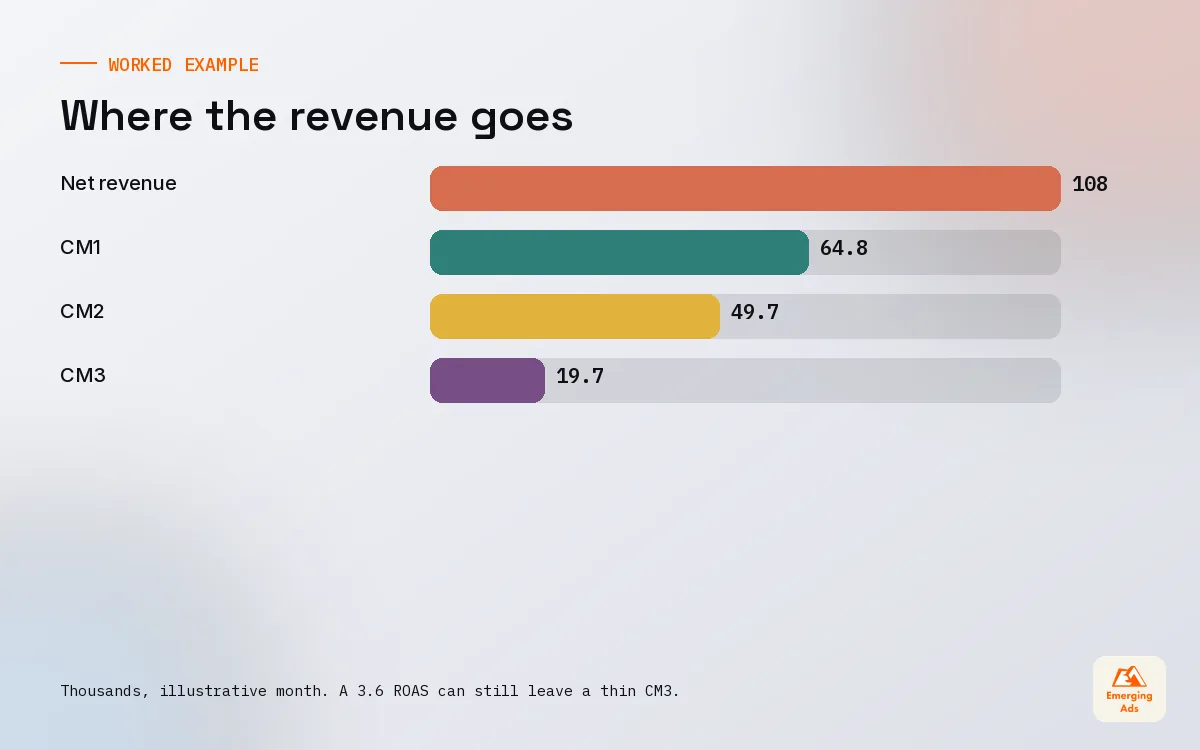
Here is a simplified month for an online store, with illustrative numbers. The point is the method.
| Line | Amount | Running total |
|---|---|---|
| Gross sales | 120,000 | |
| Minus discounts and refunds | -12,000 | Net revenue 108,000 |
| Minus cost of goods | -43,200 | CM1 64,800 (60 percent) |
| Minus shipping and packaging | -10,800 | |
| Minus payment and platform fees | -4,300 | CM2 49,700 (46 percent) |
| Minus ad spend | -30,000 | CM3 19,700 (18 percent) |
This store reports a ROAS of 3.6 on its ads (108,000 divided by 30,000), which looks comfortable. But its CM3 of about 18 percent has to cover salaries, rent, software and everything else. If fixed costs are 25,000 a month, the business is losing money despite a healthy-looking ROAS.
That is the gap contribution margin exposes. It is also why we never set ad targets without a contribution margin view in place.
04How contribution margin sets your ad targets
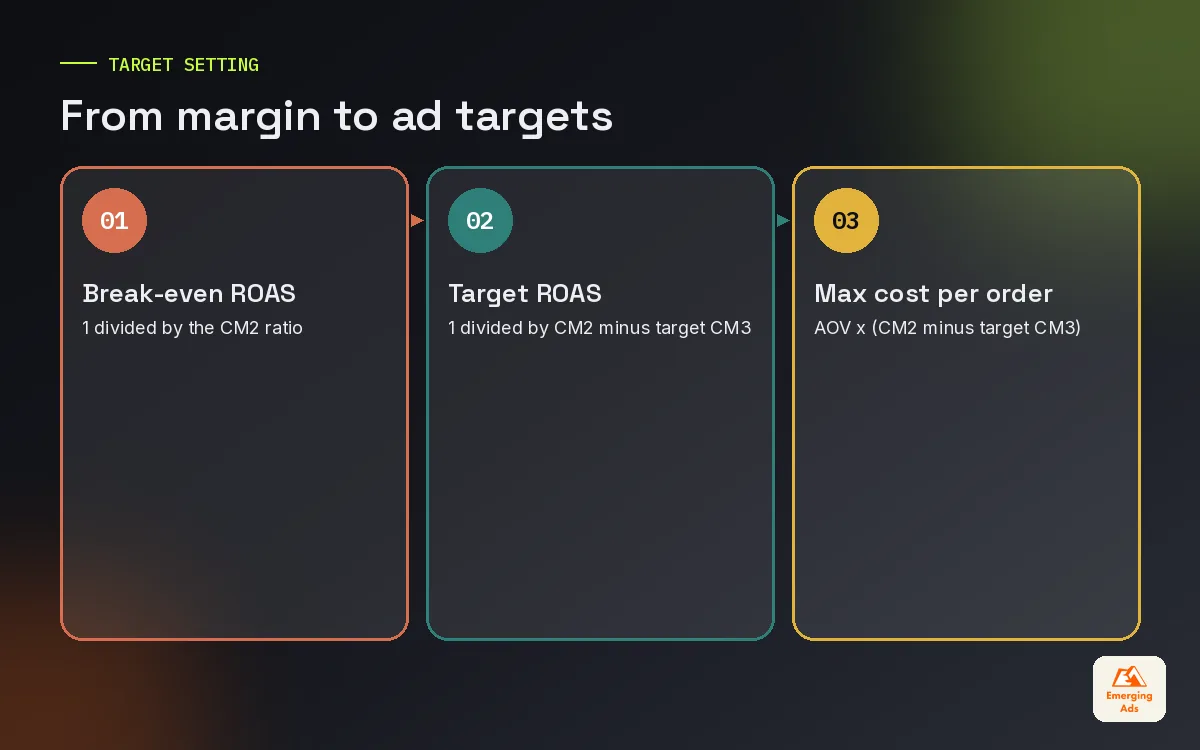
Once you know CM2, the margin before ads, you can set ad targets that are tied to profit.
- Break-even ROAS equals 1 divided by the CM2 ratio. At 46 percent, break-even ROAS is about 2.2.
- Target ROAS for a desired CM3 equals 1 divided by (CM2 ratio minus target CM3 ratio). For a 20 percent CM3 at a 46 percent CM2, that is 1 divided by 0.26, about 3.8.
- Maximum cost per order equals average order value multiplied by (CM2 ratio minus target CM3 ratio).
These formulas turn an argument about whether 3x is a good ROAS into a clear answer for your business. We set every campaign target this way and keep the numbers in the Looker Studio dashboard so the team can see them next to live results.
05Contribution margin by product and channel
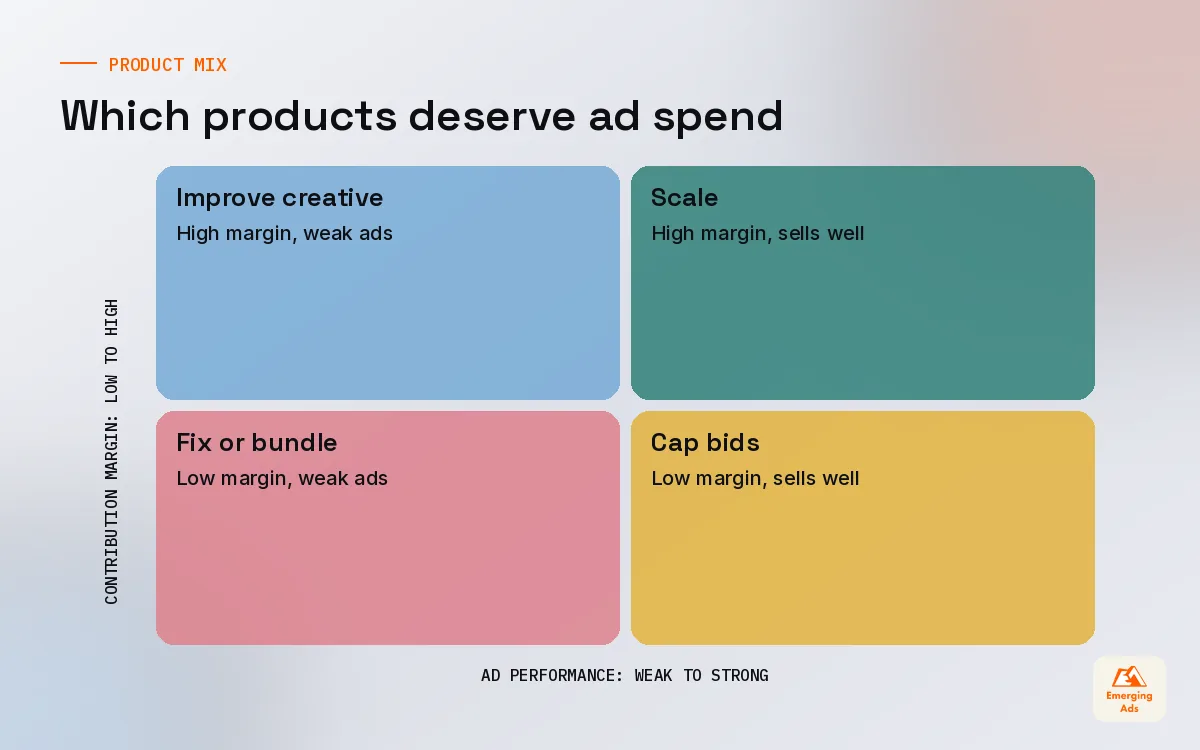
A single average contribution margin hides a lot. When we break it down for new clients, we almost always find products that lose money every time they are sold through ads, carried by a few products with strong margins.
By product
Low-priced items with heavy shipping costs, products with high return rates, and items bought mainly with discount codes often have weak CM2. Advertising them can make CM3 negative. Excluding them from shopping feeds and Google Shopping ads, or bundling them with stronger products, often lifts account profit quickly.
By channel
The same product can have a different contribution margin depending on where it sells. Marketplace referral and fulfilment fees change CM2 for Amazon sales, which is why our Amazon PPC guide and Amazon PPC management reporting look at profit after fees rather than ACoS alone. Social platforms may bring buyers with larger baskets but higher return rates. Measuring CM3 by channel shows where each unit of spend really earns its keep.
| View | What it often reveals |
|---|---|
| Product x channel | Products that only make money on one platform |
| New vs returning customers | How long it takes to recover acquisition cost |
| Discounted vs full-price orders | Whether promotions create profit or just volume |
| Order size bands | The basket size below which ads cannot pay |
06Ways to improve contribution margin
When CM3 is too thin, the instinct is to cut ad spend. Sometimes that is right. More often, the better gains sit elsewhere in the chain.
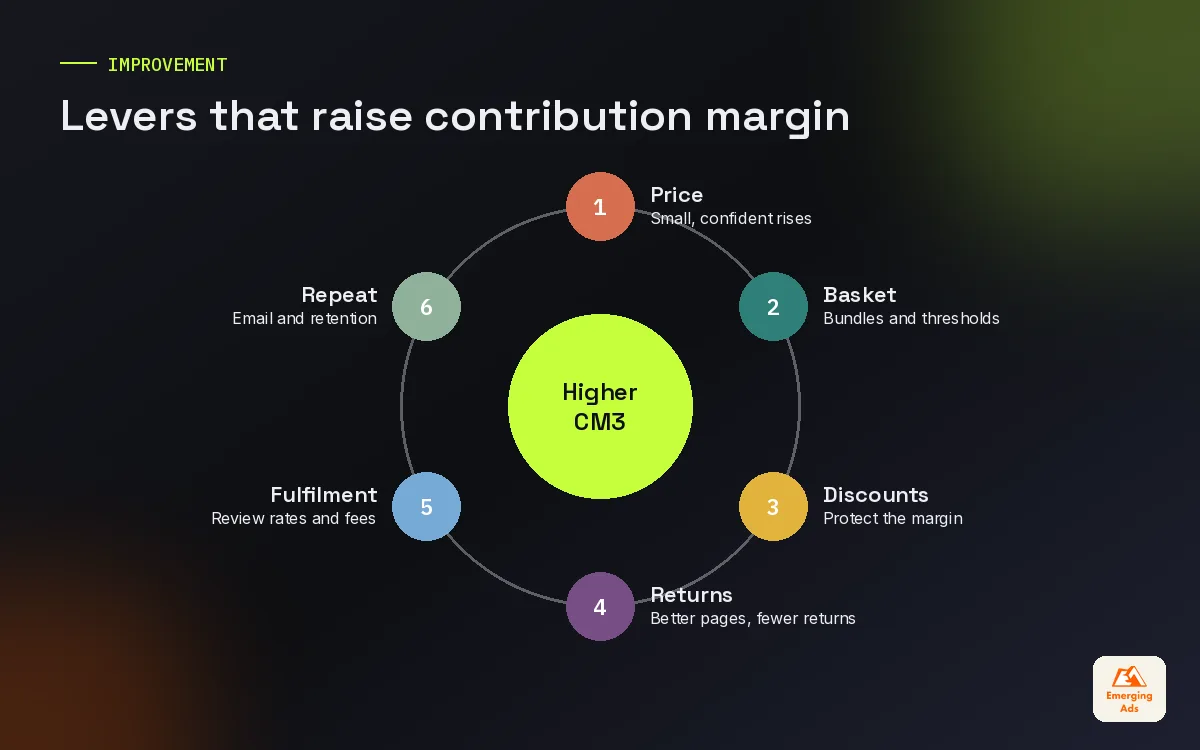
- Price with confidence. Small price increases on products with strong demand often fall straight to contribution margin.
- Raise basket size. Bundles, multi-buy offers and a free-shipping threshold set above your average order value spread fixed per-order costs over more revenue.
- Rethink discounting. Replace blanket discount codes with gifts with purchase or bundles that protect margin.
- Fix returns. Better size guides, product photos and descriptions reduce returns, which directly raises CM2.
- Renegotiate fulfilment. Shipping rates, packaging and payment fees are rarely reviewed often enough.
- Improve conversion rates. A better landing page lowers ad cost per order without cutting reach. Our conversion optimisation work regularly adds several points of CM3.
- Grow repeat revenue. Repeat orders usually carry little or no ad cost. A good email marketing programme is often the cheapest contribution margin lever available.
07Using contribution margin in paid media decisions
Here is how contribution margin changes the day-to-day running of ad accounts we manage.
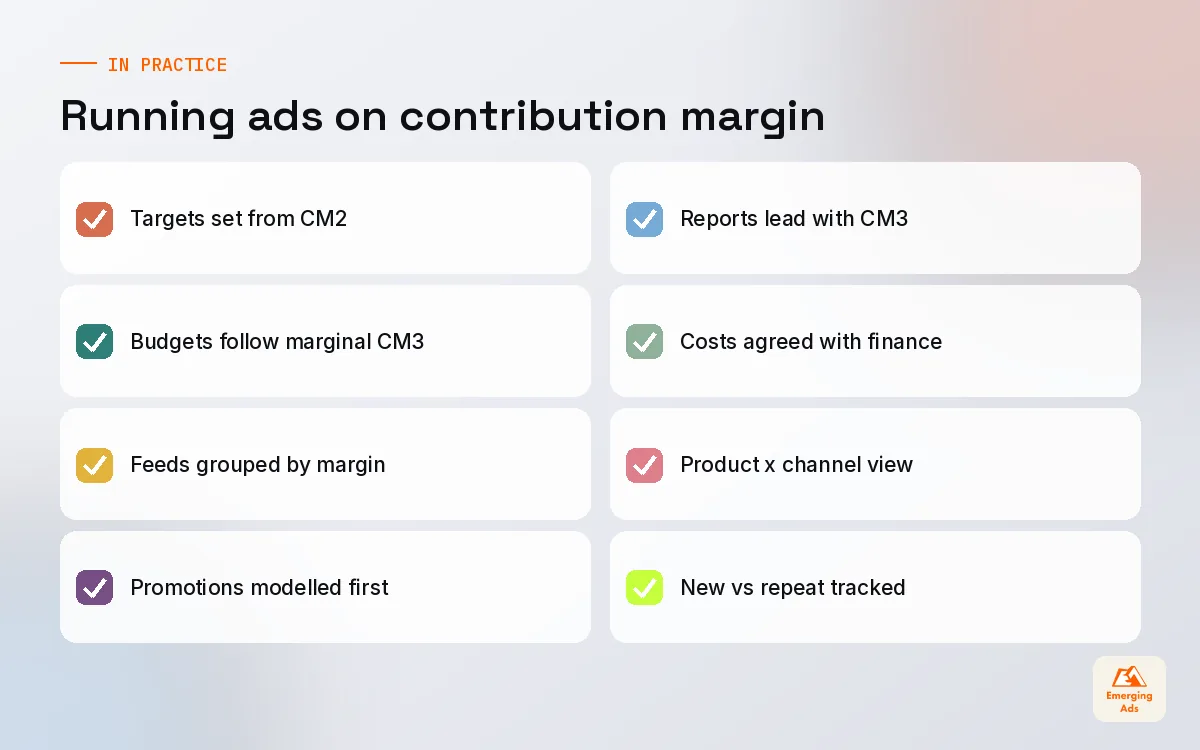
- Targets: every campaign has a target ROAS or cost per order calculated from CM2, not a round number.
- Budget moves: money moves towards channels and campaigns with the best CM3 on the marginal spend. Our ad budget allocation guide covers how.
- Product feeds: products are grouped by margin so bids can be higher for high-margin items and lower or zero for weak ones, which is especially powerful for Meta ads for e-commerce catalogues.
- Promotions: every planned sale is modelled for CM3 before it runs, not after.
- Reporting: weekly reports lead with CM3 alongside revenue, so nobody celebrates a record sales week that lost money.
Getting the data together is the hard part. Product costs live in one system, fees in another, ad spend across several platforms. We usually connect them in a single dashboard and agree the cost assumptions with the finance team once, then refresh automatically. For attribution questions about which channel deserves credit for CM3, attribution modelling completes the picture.
A record revenue month that lowers contribution margin is not a record month.
08Getting started this week
You do not need a finance system overhaul to start. Take last month’s numbers and build the simple waterfall from gross sales down to CM3. Use averages for costs you cannot yet track per order. Then do the same for your top ten products. The first version will be rough, and it will still change how you think about your ad spend.
A simple product sheet is enough to start. List each product with its net selling price, cost of goods, average shipping and packaging cost, payment and platform fees, return rate, and the average ad cost per order from last month. Add a column for CM2 and one for CM3, and sort by CM3. The products at the bottom of that list are the first conversation to have with your team, because they are the ones where more ad spend makes the business poorer.
Then pick one action for each group. For products with weak CM3 and strong demand, test a small price rise or a bundle. For products with weak CM3 and weak demand, stop advertising them on their own. For products with strong CM3, check whether they are getting enough budget, because they are often underfunded while weaker products soak up spend.
If you would like a team to build it with you and connect it to your campaigns, our e-commerce marketing services and wider paid media services include contribution margin reporting as standard. You can also read more about how we report profit before reach on the oldemergingads.com homepage.
Frequently asked questions
Straight answers to what clients ask us most about contribution margin.
What is contribution margin?
What is the contribution margin formula?
What is the difference between gross margin and contribution margin?
What are CM1, CM2 and CM3?
What is a good contribution margin?
How does contribution margin relate to ROAS?
Should ad spend be included in contribution margin?
Can contribution margin be negative?
How do I calculate contribution margin per product?
How often should I review contribution margin?
How can I improve contribution margin without cutting ads?
Do you know your contribution margin after ads, by product?
Share your product costs, fees and last quarter's ad spend. We will build a contribution margin view by channel and product and show you where profit is leaking.
Book your free audit